Savvy traders never pay full fees. Use these referral codes to save for life: Binance WZ9KD49N / OKX 26021839
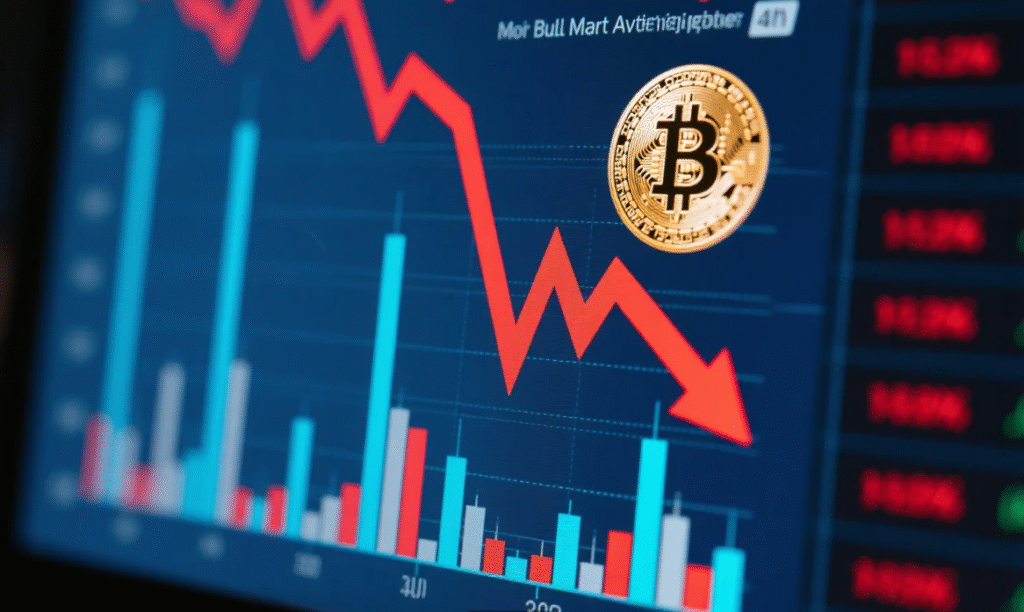
Bitcoin has soared to a record-breaking $116,000 in September 2025, cementing its status as a crypto juggernaut. Yet, beneath the surface, a puzzling contradiction emerges: eight out of ten key bull market indicators have turned bearish, signaling potential trouble. Why is BTC still climbing despite these warning signs? This article dissects these indicators, their implications, and what investors should watch for in this high-stakes market moment.
The 10 Key Bitcoin Bull Indicators
Definition and Sources
- Bull indicators are metrics from on-chain data, market signals, and technical analysis used to predict Bitcoin’s price trends.
- Sources include trusted platforms like Glassnode, CryptoQuant, CoinMetrics, and exchanges like Binance.
Common Bull Indicators
- BTC Dominance: Bitcoin’s market cap share relative to the total crypto market.
- MVRV Ratio: Market value divided by realized value, gauging overvaluation.
- SOPR (Spent Output Profit Ratio): Measures profit levels when Bitcoin is spent.
- NUPL (Net Unrealized Profit/Loss): Tracks unrealized profit or loss across the network.
- Hashrate & Mining Difficulty: Network computing power and mining complexity.
- Exchange Inflows/Outflows: Bitcoin flows to and from exchanges.
- Stablecoin Supply Ratio (SSR): Stablecoin supply relative to Bitcoin’s market cap.
- Funding Rates & Open Interest (OI): Derivative market leverage and contract volume.
- Whale Wallet Accumulation: Activity of wallets holding large BTC amounts.
- Retail Participation: Engagement from small-scale investors.
Which 8 Indicators Turned Bearish?
MVRV Ratio: Market Overheating
- MVRV ratio exceeds 3.5, indicating Bitcoin’s market value is far above its realized value, a classic overheating signal.
- Historically, MVRV > 3 often precedes temporary market tops, per Glassnode.
NUPL Nearing “Greed” Zone
- NUPL hits ~0.7, entering the “euphoria” zone where investors are likely to take profits.
- This mirrors peaks seen in 2017 and 2021, signaling caution.
SOPR: Rising Profit-Taking
- SOPR climbs above 1.1, showing increased profit-taking as investors sell at a profit.
- This trend often correlates with growing sell pressure.
Exchange Inflows Spike: Potential Sell Pressure
- Exchange inflows rose 20% this week, per CryptoQuant, suggesting investors are moving BTC to exchanges for potential sales.
- High exchange deposits can foreshadow price declines.
Funding Rates Too High: Over-Leverage Risk
- Funding rates on derivatives platforms like Binance hit 0.1%, well above average.
- Elevated rates indicate excessive leverage, risking liquidations if prices dip.
Whale Wallets Selling Off
- Whale wallets (holding >1,000 BTC) have slowed accumulation, with some selling incrementally over the past two weeks, per CoinMetrics.
- This contrasts with heavy whale buying earlier in 2025.
Stablecoin Inflows Waning
- Stablecoin Supply Ratio (SSR) dropped 15%, signaling weaker inflows of stablecoins (e.g., USDT) into Bitcoin.
- This suggests fading demand for new BTC purchases.
BTC Dominance Slips: Capital Flows to Altcoins
- BTC dominance fell from 58% to 54% this month, per CoinMarketCap.
- Capital is shifting to altcoins, diluting Bitcoin’s market strength.
Why Is Bitcoin Still at $116K?
ETF and Institutional Inflows
- Spot Bitcoin ETFs, like BlackRock’s iShares, saw $1.2 billion in inflows this week, per Bloomberg.
- Institutional buying continues to drive prices despite bearish signals.
Macro Environment: Rate Expectations and Liquidity
- Anticipated global interest rate cuts in late 2025 are boosting liquidity, supporting BTC’s rally.
- Bitcoin’s “safe haven” narrative grows amid economic uncertainty.
Persistent Bullish Sentiment
- Despite bearish indicators, investor sentiment remains bullish, fueled by ETF hype and institutional adoption.
- The Fear & Greed Index sits at 75/100, leaning toward “greed.”
Short-Term Buying Momentum Overshadows Warnings
- Retail and institutional buying has driven a 30% surge in trading volume this week, per CoinGecko.
- This momentum is temporarily masking on-chain warning signals.
Traders’ Reactions and Market Sentiment
Bullish Camp: Indicators May Be “False Signals”
- Bulls argue bearish indicators are noise, with long-term trends still strong due to ETFs and Bitcoin’s halving effect.
- Some predict BTC could hit $150K by year-end 2025.
Bearish Camp: Topping Signals
- Bears warn $116K may be a temporary peak, with a potential 20–30% correction looming.
- High MVRV, SOPR, and funding rates echo 2017 and 2021 tops.
Neutral Camp: Consolidation Phase
- Neutral traders see the market in a “handover” phase, needing time to stabilize.
- They recommend waiting for clearer on-chain signals before acting.
Historical Context
Comparison to 2017 and 2021 Bull Runs
- In 2017, MVRV hit 4.0 and SOPR exceeded 1.2 before a 50% crash.
- In 2021, NUPL reached 0.75 and high funding rates preceded a drop from $69K to $30K.
- Today’s indicators align closely, but ETF inflows add a new dynamic.
Cases Where Bull Indicators Failed
- History shows bull indicators aren’t foolproof, especially when institutional flows dominate.
- Example: In 2019, MVRV signaled a top, but whale accumulation drove further gains.
Similarities and Differences with Past Peaks
- Similarities: High MVRV, NUPL, and SOPR signal profit-taking, as in past cycles.
- Differences: ETF inflows and institutional adoption provide unprecedented support, unlike earlier bull runs.
Risks and Outlook
Short-Term Risks
- Mass Profit-Taking: High SOPR and exchange inflows could trigger sell-offs.
- Leverage Liquidations: Elevated funding rates raise the risk of cascading liquidations if prices drop.
Mid-Term Possibilities
- A healthy correction (10–20%) could occur before new highs, consistent with historical patterns.
- Past cycles show corrections often lead to stronger rallies within 3–6 months.
Long-Term Factors
- Halving Effect: The 2024 Bitcoin halving continues to reduce supply, supporting long-term price growth.
- Institutional Adoption: ETFs and corporate treasuries bolster Bitcoin’s legitimacy.
- Safe Haven Demand: Global economic uncertainty drives BTC as a hedge.
Conclusion
Bitcoin’s climb to $116,000 is a milestone, but the flip of eight out of ten bull indicators to bearish raises red flags. Investors must tread carefully, avoiding the temptation to chase prices blindly amid these warning signals. Is this a prelude to a market top or just temporary noise before the next leg up? Monitoring on-chain data and capital flows will be key to navigating this pivotal moment.
FAQ
What Are Bitcoin Bull Indicators?
Bull indicators are metrics from on-chain data, market signals, and technical analysis (e.g., MVRV, SOPR) used to predict Bitcoin’s price trends.
Why Are Bitcoin Indicators Bearish at $116K?
Metrics like MVRV, NUPL, and SOPR suggest overheating, profit-taking, and high leverage, signaling potential correction risks.
Does This Mean Bitcoin Has Topped in 2025?
It’s too early to confirm, but bearish indicators hint at a short-term pullback, though long-term trends remain bullish.
How Should Traders React When Indicators Turn Bearish?
Monitor on-chain data, manage risk, and avoid FOMO. Wait for clearer signals before making big buy or sell decisions.